Tuesday, December 1, 2009

Problem Solving Skills: Final Edition

Using the Greiner Curve
Surviving the crises that come with growth


Fast growing companies can often be chaotic places to work.
As workloads increase exponentially, approaches which have worked well in the past start failing. Teams and people get overwhelmed with work. Previously-effective managers start making mistakes as their span of control expands. And systems start to buckle under increased load.

While growth is fun when things are going well, when things go wrong, this chaos can be intensely stressful. More than this, these problems can be damaging (or even fatal) to the organization.

The "Greiner Curve" is a useful way of thinking about the crises that organizations experience as they grow.

By understanding it, you can quickly understand the root cause of many of the problems you're likely to experience in a fast growing business. More than this, you can anticipate problems before they occur, so that you can meet them with pre-prepared solutions.

Understanding the Theory

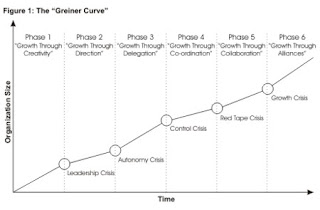
Greiner's Growth Model describes phases that organizations go through as they grow. All kinds of organizations from design shops to manufacturers, construction companies to professional service firms experience these. Each growth phase is made up of a period of relatively stable growth, followed by a "crisis" when major organizational change is needed if the company is to carry on growing.
Dictionaries define the word "crisis" as a "turning point", but for many of us it has a negative meaning to do with panic. While companies certainly have to change at each of these points, if they properly plan for there is no need for panic and so we will call them "transitions".
Larry E. Greiner originally proposed this model in 1972 with five phases of growth. Later, he added a sixth phase (Harvard Business Review, May 1998). The six growth phases are described below:

Phase 1: Growth Through Creativity

Here, the entrepreneurs who founded the firm are busy creating products and opening up markets. There aren't many staff, so informal communication works fine, and rewards for long hours are probably through profit share or stock options. However, as more staff join, production expands and capital is injected, there's a need for more formal communication.
This phase ends with a Leadership Crisis, where professional management is needed. The founders may change their style and take on this role, but often someone new will be brought in.

Phase 2: Growth Through Direction

Growth continues in an environment of more formal communications, budgets and focus on separate activities like marketing and production. Incentive schemes replace stock as a financial reward.

However, there comes a point when the products and processes become so numerous that there are not enough hours in the day for one person to manage them all, and he or she can't possibly know as much about all these products or services as those lower down the hierarchy.
This phase ends with an Autonomy Crisis: New structures based on delegation are called for.

Phase 3: Growth Through Delegation

With mid-level managers freed up to react fast to opportunities for new products or in new markets, the organization continues to grow, with top management just monitoring and dealing with the big issues (perhaps starting to look at merger or acquisition opportunities). Many businesses flounder at this stage, as the manager whose directive approach solved the problems at the end of Phase 1 finds it hard to let go, yet the mid-level managers struggle with their new roles as leaders.

This phase ends with a Control Crisis: A much more sophisticated head office function is required, and the separate parts of the business need to work together.

Phase 4: Growth Through Coordination and Monitoring

Growth continues with the previously isolated business units re-organized into product groups or service practices. Investment finance is allocated centrally and managed according to Return on Investment (ROI) and not just profits. Incentives are shared through company-wide profit share schemes aligned to corporate goals. Eventually, though, work becomes submerged under increasing amounts of bureaucracy, and growth may become stifled.
This phase ends on a Red-Tape Crisis: A new culture and structure must be introduced.

Phase 5: Growth Through Collaboration

The formal controls of phases 2-4 are replaced by professional good sense as staff group and re-group flexibly in teams to deliver projects in a matrix structure supported by sophisticated information systems and team-based financial rewards.
This phase ends with a crisis of Internal Growth: Further growth can only come by developing partnerships with complementary organizations.

Phase 6: Growth Through Extra-Organizational Solutions

Greiner's recently added sixth phase suggests that growth may continue through merger, outsourcing, networks and other solutions involving other companies.
Growth rates will vary between and even within phases. The duration of each phase depends almost totally on the rate of growth of the market in which the organization operates. The longer a phase lasts, though, the harder it will be to implement a transition.
Tip:This is a useful model, however not all businesses will go through these crises in this order. Use this as a starting point for thinking about business growth, and adapt it to your circumstances.

Using the Tool

The Greiner Growth Model helps you think about the growth for your organization, and therefore better plan for and cope with the next growth transitions. To apply the model, use the following steps:

Based on the descriptions above, think about where your organization is now.
Think about whether the organization is reaching the end of a stable period of growth, and nearing a 'crisis' or transition. Some of the signs of 'crisis' include:

People feel that managers and company procedures are getting in the way of them doing their jobs.

People feel that they are not fairly rewarded for the effort they put in.
People seem unhappy, and there is a higher staff turnover than usual.

Ask yourself what the transition will mean for you personally and your team. Will you have to:

  • Delegate more?
  • Take on more responsibilities?
  • Specialize more in a specific product or market?
  • Change the way you communicate with others?
  • Incentivize and reward you team differently?

By thinking this through, you can start to plan and prepare yourself for the inevitable changes, and perhaps help other to do the same.

Plan and take preparatory actions that will make the transition as smooth as possible for you and your team.

Revisit Greiner's model for growth again every 6-12 months, and think about how the current stage of growth affects you and others around you.

Tuesday, November 17, 2009

The McKinsey 7S Framework

The McKinsey 7S Framework
Ensuring that all parts of your organization work in harmony


How do you go about analyzing how well your organization is positioned to achieve its intended objective? This is a question that has been asked for many years, and there are many different answers. Some approaches look at internal factors, others look at external ones, some combine these perspectives, and others look for congruence between various aspects of the organization being studied. Ultimately, the issue comes down to which factors to study.While some models of organizational effectiveness go in and out of fashion, one that has persisted is the McKinsey 7S framework.

Developed in the early 1980s by Tom Peters and Robert Waterman, two consultants working at the McKinsey & Company consulting firm, the basic premise of the model is that there are seven internal aspects of an organization that need to be aligned if it is to be successful.
The 7S model can be used in a wide variety of situations where an alignment perspective is useful, for example to help you:
  • Improve the performance of a company.

  • Examine the likely effects of future changes within a company.

  • Align departments and processes during a merger or acquisition.

  • Determine how best to implement a proposed strategy.

The McKinsey 7S model can be applied to elements of a team or a project as well. The alignment issues apply, regardless of how you decide to define the scope of the areas you study.

The Seven Elements

The McKinsey 7S model involves seven interdependent factors which are categorized as either "hard" or "soft" elements:

Hard Elements:

  • Strategy

  • Structure

  • Systems

Soft Elements:

  • Shared Values

  • Skills

  • Style

  • Staff
"Hard" elements are easier to define or identify and management can directly influence them: These are strategy statements; organization charts and reporting lines; and formal processes and IT systems.

"Soft" elements, on the other hand, can be more difficult to describe, and are less tangible and more influenced by culture. However, these soft elements are as important as the hard elements if the organization is going to be successful.

The way the model is presented in Figure 1 below depicts the interdependency of the elements and indicates how a change in one affects all the others.


Let's look at each of the elements specifically:

  • Strategy: the plan devised to maintain and build competitive advantage over the competition.

  • Structure: the way the organization is structured and who reports to whom.

  • Systems: the daily activities and procedures that staff members engage in to get the job done.

  • Shared Values: called "superordinate goals" when the model was first developed, these are the core values of the company that are evidenced in the corporate culture and the general work ethic.

  • Style: the style of leadership adopted.

  • Staff: the employees and their general capabilities.

  • Skills: the actual skills and competencies of the employees working for the company.

Placing Shared Values in the middle of the model emphasizes that these values are central to the development of all the other critical elements. The company's structure, strategy, systems, style, staff and skills all stem from why the organization was originally created, and what it stands for. The original vision of the company was formed from the values of the creators. As the values change, so do all the other elements.


How to Use the Model

Now you know what the model covers, how can you use it?

The model is based on the theory that, for an organization to perform well, these seven elements need to be aligned and mutually reinforcing. So, the model can be used to help identify what needs to be realigned to improve performance, or to maintain alignment (and performance) during other types of change.

Whatever the type of change - restructuring, new processes, organizational merger, new systems, change of leadership, and so on - the model can be used to understand how the organizational elements are interrelated, and so ensure that the wider impact of changes made in one area is taken into consideration.

You can use the 7S model to help analyze the current situation (Point A), a proposed future situation (Point B) and to identify gaps and inconsistencies between them. It's then a question of adjusting and tuning the elements of the 7S model to ensure that your organization works effectively and well once you reach the desired endpoint.

Sounds simple? Well, of course not: Changing your organization probably will not be simple at all! Whole books and methodologies are dedicated to analyzing organizational strategy, improving performance and managing change. The 7S model is a good framework to help you ask the right questions - but it won't give you all the answers. For that you'll need to bring together the right knowledge, skills and experience.

When it comes to asking the right questions, we've developed a checklist and a matrix to keep track of how the seven elements align with each other. Supplement these with your own questions, based on your organization's specific circumstances and accumulated wisdom.

7S Checklist QuestionsHere are some of the questions that you'll need to explore to help you understand your situation in terms of the 7S framework. Use them to analyze your current (Point A) situation first, and then repeat the exercise for your proposed situation (Point B).


Strategy:

What is our strategy?
How do we intend to achieve our objectives?
How do we deal with competitive pressure?
How are changes in customer demands dealt with?
How is strategy adjusted for environmental issues?

Structure:

How is the company/team divided?
What is the hierarchy?
How do the various departments coordinate activities?
How do the team members organize and align themselves?
Is decision making and controlling centralized or decentralized? Is this as it should be, given what we're doing?
Where are the lines of communication? Explicit and implicit?

Systems:

What are the main systems that run the organization? Consider financial and HR systems as well as communications and document storage.
Where are the controls and how are they monitored and evaluated?
What internal rules and processes does the team use to keep on track?

Shared Values:

What are the core values?
What is the corporate/team culture?
How strong are the values?
What are the fundamental values that the company/team was built on?

Style:

How participative is the management/leadership style?
How effective is that leadership?
Do employees/team members tend to be competitive or cooperative?
Are there real teams functioning within the organization or are they just nominal groups?

Staff:

What positions or specializations are represented within the team?
What positions need to be filled?
Are there gaps in required competencies?

Skills:

What are the strongest skills represented within the company/team?
Are there any skills gaps?
What is the company/team known for doing well?
Do the current employees/team members have the ability to do the job?
How are skills monitored and assessed?

7S matrix questions

Using the information you have gathered, now examine where there are gaps and inconsistencies between elements. Remember you can use this to look at either your current or your desired organization.


Click here to download our McKinsey 7S Worksheet, which contains a matrix that you can use to check off alignment between each of the elements as you go through the following steps:

Start with your Shared Values: Are they consistent with your structure, strategy, and systems? If not, what needs to change?

Then look at the hard elements. How well does each one support the others? Identify where changes need to be made.

Next look at the other soft elements. Do they support the desired hard elements? Do they support one another? If not, what needs to change?

As you adjust and align the elements, you'll need to use an iterative (and often time consuming) process of making adjustments, and then re-analyzing how that impacts other elements and their alignment.


The end result of better performance will be worth it.


Key Points


The McKinsey 7Ss model is one that can be applied to almost any organizational or team effectiveness issue. If something within your organization or team isn't working, chances are there is inconsistency between some of the elements identified by this classic model. Once these inconsistencies are revealed, you can work to align the internal elements to make sure they are all contributing to the shared goals and values.

The process of analyzing where you are right now in terms of these elements is worthwhile in and of itself. But by taking this analysis to the next level and determining the ultimate state for each of the factors, you can really move your organization or team forward.

Wednesday, September 16, 2009

Critical Success Factors

Identifying the things that really matter for success

So many important matters can compete for your attention in business that it's often difficult to see the "wood for the trees". What's more, it can be extremely difficult to get everyone in the team pulling in the same direction and focusing on the true essentials.
That's where Critical Success Factors (CSFs) can help. CSFs are the essential areas of activity that must be performed well if you are to achieve the mission, objectives or goals for your business or project.
By identifying your Critical Success Factors, you can create a common point of reference to help you direct and measure the success of your business or project.
As a common point of reference, CSFs help everyone in the team to know exactly what's most important. And this helps people perform their own work in the right context and so pull together towards the same overall aims.
The idea of CSFs was first presented by D. Ronald Daniel in the 1960s. It was then built on and popularized a decade later by John F. Rockart, of MIT's Sloan School of Management, and has since been used extensively to help businesses implement their strategies and projects.
Inevitably, the CSF concept has evolved, and you may have seen it implemented in different ways. This article provides a simple definition and approach based on Rockart's original ideas.
Rockart defined CSFs as:
"The limited number of areas in which results, if they are satisfactory, will ensure successful competitive performance for the organization. They are the few key areas where things must go right for the business to flourish. If results in these areas are not adequate, the organization's efforts for the period will be less than desired."He also concluded that CSFs are "areas of activity that should receive constant and careful attention from management."Critical Success Factors are strongly related to the mission and strategic goals of your business or project. Whereas the mission and goals focus on the aims and what is to be achieved, Critical Success Factors focus on the most important areas and get to the very heart of both what is to be achieved and how you will achieve it.

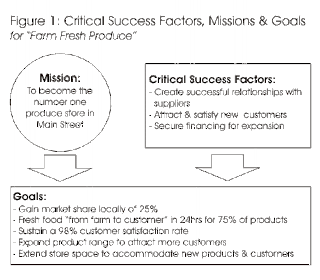
Using the Tool: An ExampleCSFs are best understood by example. Consider a produce store "Farm Fresh Produce", whose mission is:"To become the number one produce store in Main Street by selling the highest quality, freshest farm produce, from farm to customer in under 24 hours on 75% of our range and with 98% customer satisfaction."(For more on this example, and how to develop your mission statement, see our article on Vision Statements and Mission Statements.)The strategic objectives of Farm Fresh are to:

Gain market share locally of 25%.
Achieve fresh supplies of "farm to customer" in 24 hours for 75% of products.
Sustain a customer satisfaction rate of 98%.
Expand product range to attract more customers.
Have sufficient store space to accommodate the range of products that customers want.


In order to identify possible CSFs, we must examine the mission and objectives and see which areas of the business need attention so that they can be achieved. We can start by brainstorming what the Critical Success Factors might be (these are the "Candidate" CSFs.)


Objective Candidate
Gain market share locally of 25%

Critical Success Factors
Increase competitiveness versus other local stores

Objective CandidateAttract new customers
Achieve fresh supplies from "farm to customer" in 24 hours for 75% of products

Critical Success Factors
Sustain successful relationships with local suppliers

Objective Candidate
Sustain a customer satisfaction rate of 98%

Critical Success Factors
Retain staff and keep up customer-focused training

Objective Candidate
Expand product range to attract more customers

Critical Success Factors
Source new products locally

Objective Candidate
Extend store space to accommodate new products and customers

Critical Success Factors
Secure financing for expansion


Once you have a list of Candidate CSFs, it's time to consider what is absolutely essential and so identify the truly Critical Success Factors.And this is certainly the case for Farm Fresh Produce. One CSF that we identify from the candidate list is "Sustain successful relationships with local suppliers." This is absolutely essential to ensure freshness and to source new products.Another CSF is to attract new customers. Without new customers, the store will be unable to expand to increase market share.A third CSF is financing for expansion. The store's objectives cannot be met without the funds to invest in expanding the store space.


Tip: How Many CSFs?Whilst there is no hard and fast rule, it's useful to limit the number of CSFs to five or fewer absolute essentials. This helps you maintain the impact of your CSFs, and so give good direction and prioritization to other elements of your business or project strategy.


Using the Tool: Summary Steps


In reality, identifying your CSFs is a very iterative process. Your mission, strategic goals and CSFs are intrinsically linked and each will be refined as you develop them.Here are the summary steps that, used iteratively, will help you identify the CSFs for your business or project:Step One: Establish your business's or project's mission and strategic goals (click here for help doing this.)Step Two: For each strategic goal, ask yourself "what area of business or project activity is essential to achieve this goal?" The answers to the question are your candidate CSFs.


Tip: How Many CSFs?To make sure you consider all types of possible CSFs, you can use Rockart's CSF types as a checklist.
Industry - these factors result from specific industry characteristics. These are the things that the organization must do to remain competitive.
Environmental - these factors result from macro-environmental influences on an organization. Things like the business climate, the economy, competitors, and technological advancements are included in this category.
Strategic - these factors result from the specific competitive strategy chosen by the organization. The way in which the company chooses to position themselves, market themselves, whether they are high volume low cost or low volume high cost producers, etc.
Temporal - these factors result from the organization's internal forces. Specific barriers, challenges, directions, and influences will determine these CSFs.


Step Three: Evaluate the list of candidate CSFs to find the absolute essential elements for achieving success - these are your Criticial Success Factors.As you identify and evaluate candidate CSFs, you may uncover some new strategic objectives or more detailed objectives. So you may need to define your mission, objectives and CSFs iteratively.


Step Four: Identify how you will monitor and measure each of the CSFs.


Step Five: Communicate your CSFs along with the other important elements of your business or project's strategy.Step Six: Keep monitoring and reevaluating your CSFs to ensure you keep moving towards your aims. Indeed, whilst CSFs are sometimes less tangible than measurable goals, it is useful to identify as specifically as possible how you can measure or monitor each one.


Key Points


Critical Success Factors are the areas of your business or project that are absolutely essential to its success. By identifying and communicating these CSFs, you can help ensure your business or project is well-focused and avoid wasting effort and resources on less important areas. By making CSFs explicit, and communicating them with everyone involved, you can help keep the business and project on track towards common aims and goals.

Wednesday, September 2, 2009

Problem Solving 14: USP Analysis

USP Analysis

The Unique Selling Proposition: Crafting Your "Competitive Edge"


For years, business trainers have stressed the importance of "USPs" (Unique Selling Propositions). Your USP is the unique thing that you can offer that your competitors can't. It's your "Competitive Edge". It’s the reason that customers buy from you and you alone.

USPs have helped many companies succeed. And they can help you too when you’re marketing yourself (when seeking a promotion, finding a new job or just making sure you get the recognition you deserve.) If you don't have a USP, you're condemned to a struggle for survival - that way lies hard work and little reward.

However, USPs are often extremely difficult to find. And as soon as one company establishes a successful USP in a market, competitors rush to copy it.

This tool helps you find your USP. And it then helps you think about how you’ll defend it.

How to use the tool:

Follow these four steps:

1. Understand the Characteristics that Customers Value:First, brainstorm what customers value about your product or services and those of your competitors. Move beyond the basics common to all suppliers in the industry, and look at the criteria customers use to decide which product or service to buy.

As with all brainstorming, by involving knowledgeable people in the process, you'll improve the range of characteristics you’ll identify. So talk to sales people, customer service teams and, most importantly, talk to customers themselves.

2. Rank Yourself and Your Competitors By These Criteria:Now identify your top competitors. Being as objective as you can, score yourself and each of your competitors out of 10 for each characteristic. Where possible, base your scores on objective data. Where you can’t, do your best to see things from a customer’s perspective and make your best guess.

3. Identify Where You Rank Well:Now, plot these points on a graph. This helps you spot different competitors’ strengths and weaknesses.And from this, develop a simple, easily communicated statement of your USP.

Tip:
When you identify your USP, make sure it’s something that really matters to potential customers. There’s no point in being the best in industry for something they don’t care about.


4. Preserve Your USP (and Use It!):The final step is to make sure you can defend your USP. You can be sure that as soon as you start promote a USP, your competitors will do what they can to neutralize it: If you’ve got the best website, they'll bring in a better web designer. If you’ve got a great new feature in your product, you’ll see it in theirs next year.


If you’ve established a USP, it makes sense to invest to defend it - that way, competitors will struggle to keep up: By the time they’ve improved, you’ve already moved to the next stage.And once you’ve established a USP, make sure the market knows about it!


Example: Dan Jackson, the new CEO of LPC Office Supplies, was worried. He was confused by the situation he'd inherited, and felt that the company was drifting. Part of this, he felt, was that the company had no distinctive market position. He decided to use USP Analysis to find one.After talking to the company's biggest customers, Dan has identified the following criteria as important:


- Price
- Quality of merchandise
- Range
- Catalog quality
- Website appearance and navigation
- Ease of ordering
- Speed of delivery
- Reliability of delivery

.He then ranks LPC and its competitors using the criteria he had identified. Some criteria he assesses objectively, and on others he relies on instinct, market reputation and salespeople's reports.


This gives him the table below:
LPC BAR ROS HTX
- Price 7 9 6 6
- Quality of merchandise 7 7 7 7
- Range 9 6 5 9
- Catalog quality 9 7 6 9
- Website appearance 9 7 6 8
and navigation
- Ease of ordering 7 7 7 6
- Speed of delivery 6 7 9 7
- Reliability of delivery. 7 7 9 7


Using these rankings, Dan plots this graph:


As he does, different industry USPs start to become plain. Barnwick Smith seems to operate a “pile ‘em high and sell ‘em cheap” policy. The Roskan Group seems to focus on fast, reliable delivery, possibly of urgent, essential materials. Looking at these, Dan is sure that LPC can compete effectively against these competitors by emphasizing the breadth of its range and the quality of its catalog. However, HTX Supplies is more problematic: Curves are quite close. Even here, though, LPC seems to have better customer service and a better website. A USP of “The easy way to buy everything you need!” seems to work well.

Dan decides to invest in LPC's website and its customer service systems, with a view to opening up a clear gap between itself and HTX. And he then launches a marketing campaign stressing LPC's USP.

Key points:
USP Analysis is a useful way of understanding how people are competing in your industry. And it's essential for identifying your USP, so that you know what to build upon and emphasize to your prospects.

USP Analysis is a four stage process:
First, you list the decision criteria (explicit and hidden) that customers of your industry use in making purchase decisions;
Second, you rank yourself and your competitors by these criteria;
Third, you look at where you rank well, and craft a USP from this; and
Finally, you look at how you will defend and build your USP as competition evolves

Sunday, August 16, 2009

Problem Solving Skills: Part 13 - Core Competence Analysis

Core Competence Analysis
Get Ahead. Stay Ahead.


The idea of the “core competence” is one of the most important business ideas that has shaped our world. It is one of the key ideas that lies behind the current wave of outsourcing, as businesses concentrate their efforts on things they do well, and outsource as much as they can of everything else.

In this article we explain the idea and help you use it, on both corporate and personal levels. And by doing so, we show you how you can get ahead of your competition – and stay ahead.
By using the idea, you can make the very most of the opportunities open to you:
You can focus your efforts so that you develop a unique level of expertise in areas that really matter to your customers. Because of this, you’ll command the rewards that come with this expertise; and

You can learn to develop your own skills in a way that complements your company’s core competences. By building the skills and abilities that your company most values, you’ll win respect and be more likely to get the career advancement that you want.

Explaining Core Competences: The Value of Uniqueness

The starting point for understanding core competences is understanding that businesses must have something that customers uniquely value if they're to make good profits. "Me too" businesses (with nothing unique to distinguish them from their competition) are doomed to compete on price: The only thing they can do to make themselves the customer's top choice is drop price. And as other "me too" businesses do the same, profit margins become thinner and thinner.This is why there's such an emphasis on building and selling USPs (Unique Selling Points) in business: If you're able to offer something uniquely good, customers will want to choose your products and will be willing to pay more for them.The question, though, is where this uniqueness comes from, and how it can be sustained.In their key 1990 paper "The Core Competence of the Corporation", C.K.Prahalad and Gary Hamel argue that "Core Competences" are some of the most important sources of uniqueness: These are the things that a company can do uniquely well, and that no-one else can copy quickly enough to affect competition.Prahalad and Hamel used examples of slow-growing and now-forgotten corporations that failed to recognize and capitalize on their strengths. They compared them with star performers of the 1980s (such as NEC, Canon and Honda), which had a very clear idea of what they were good at, and which grew very fast.

Because these companies were focused on their core competences, and continually worked to build and reinforce them, their products were more advanced than those of their competitors, and customers were prepared to pay more for them. And as they switched effort away from areas where they were weak, and further focused on areas of strength, their products built up more and more of a market lead.

Now you'll probably find this an attractive idea, and it's often easy to think about a whole range of things that a company does that it can do well. However, Hamel and Prahalad give three tests to see whether they are true core competences:


Relevance: Firstly, the competence must give your customer something that strongly influences him or her to choose your product or service. If it does not, then it has no effect on your competitive position and is not a core competence;

Difficulty of Imitation: Secondly, the core competence should be difficult to imitate. This allows you to provide products that are better than those of your competition. And because you're continually working to improve this competence, ir means that you can sustain your competitive position; and

Breadth of Application: Thirdly, it should be something that opens up a good number of potential markets. If it only opens up a few small, niche markets, then success in these markets will not be enough to sustain significant growth.


An example: You might consider strong industry knowledge and expertise to be a core competence in serving your industry. However, if your competitors have equivalent expertise, then this is not a core competence. All it does is make it more difficult for new competitors to enter the market. More than this, it's unlikely to help you much in moving into new markets, which will have established experts already. (Test 1: Yes. Test 2: No. Test 3: Probably not.)

Using This in Your Business and Career:

To identify your core competences, use the following steps:

Brainstorm the factors that are important to your clients.

If you're doing this on behalf of your company, identify the factors that influence people's purchase decisions when they're buying products or services like yours (make sure that you move beyond just product or service features and include all decision-making points.)

If you're doing this for yourself, brainstorm the factors (for example) that people use in assessing you for annual performance reviews or promotion, or for new roles you want.Then dig into these factors, and identify the competences that lie behind them. As a corporate example, if customers value small products (e.g. cell phones), then the competence they value may be "component integration and miniaturization".

Brainstorm your existing competences and the things you do well.
For the list of your own competences, screen them against the tests of Relevance, Difficulty of Imitation and Breadth of Application, and see if any of the competences you've listed are core competences.

For the list of factors that are important to clients, screen them using these tests to see if you could develop these as core competences.

Review the two screened lists, and think about them:

If you've identified core competences that you already have, then great! Work on them and make sure that you build them as far as sensibly possible;

If you have no core competences, then look at ones that you could develop, and work to build those; or

If you have no core competences and it doesn't look as if you can build any that customers would value, then either you need another way of being unique in your market (see our USP Analysis article), or you need to consider finding another environment that better suits your competences.

Think of the most time-consuming and costly things that you do either as an individual or a company.If any of these things do not contribute to a core competence, ask yourself if you can outsource them effectively, clearing down time so that you can focus on core competences.For example, as an individual, are you still doing your own cleaning, ironing and decorating? As a small business, are you doing you own HR and payroll? As a bigger business, are you manufacturing non-core product components, or performing non-core activities?


Tip 1:As with all brainstorming, you'll get better results if you involve other (carefully-chosen) people.

Tip 2:On a personal basis and in the short term, it might be difficult to come up with truly unique core competences. However, keep this idea in mind and work to develop unique core competences.

Tip 3:You may find it quite difficult to find any true core competences in your business. If you've got a successful business that's sustainably outperforming rivals, then maybe something else is fuelling your success.

However, if you're working very hard, and you're still finding it difficult to make a profit, then you need to think carefully about crafting a unique competitive position.This may involve developing core competences that are relevant, real and sustainable.

Tip 4:As ever, if your going to put more effort into some areas, you're going to have to put less effort into others. You only have a finite amount of time, and if you try to do too much, you'll do little really well.

Tuesday, August 4, 2009

Porter's 5 Forces: Part 12

Porter's Five Forces
Assessing the Balance of Power in a Business Situation


The Porter's 5 Forces tool is a simple but powerful tool for understanding where power lies in a business situation. This is useful, because it helps you understand both the strength of your current competitive position, and the strength of a position you're looking to move into.
With a clear understanding of where power lies, you can take fair advantage of a situation of strength, improve a situation of weakness, and avoid taking wrong steps. This makes it an important part of your planning toolkit.


Conventionally, the tool is used to identify whether new products, services or businesses have the potential to be profitable. However it can be very illuminating when used to understand the balance of power in other situations too.
How to Use the Tool:


Five Forces Analysis assumes that there are five important forces that determine competitive power in a situation. These are:


Supplier Power: Here you assess how easy it is for suppliers to drive up prices. This is driven by the number of suppliers of each key input, the uniqueness of their product or service, their strength and control over you, the cost of switching from one to another, and so on. The fewer the supplier choices you have, and the more you need suppliers' help, the more powerful your suppliers are.
Buyer Power: Here you ask yourself how easy it is for buyers to drive prices down. Again, this is driven by the number of buyers, the importance of each individual buyer to your business, the cost to them of switching from your products and services to those of someone else, and so on. If you deal with few, powerful buyers, they are often able to dictate terms to you.
Competitive Rivalry: What is important here is the number and capability of your competitors – if you have many competitors, and they offer equally attractive products and services, then you’ll most likely have little power in the situation. If suppliers and buyers don’t get a good deal from you, they’ll go elsewhere. On the other hand, if no-one else can do what you do, then you can often have tremendous strength.
Threat of Substitution: This is affected by the ability of your customers to find a different way of doing what you do – for example, if you supply a unique software product that automates an important process, people may substitute by doing the process manually or by outsourcing it. If substitution is easy and substitution is viable, then this weakens your power.
Threat of New Entry: Power is also affected by the ability of people to enter your market. If it costs little in time or money to enter your market and compete effectively, if there are few economies of scale in place, or if you have little protection for your key technologies, then new competitors can quickly enter your market and weaken your position. If you have strong and durable barriers to entry, then you can preserve a favorable position and take fair advantage of it.


These forces can be neatly brought together in a diagram like the one below:
To use the tool to understand your situation, look at each of these forces one-by-one.


Brainstorm the relevant factors for your market or situation, and then check against the factors listed for the force in the diagram above.


Then order your free worksheet by sending a blank e-mail to: nyman@consultant.com (subject line: Porter's Worksheet), mark the key factors on the diagram, and summarize the size and scale of the force on the diagram. An easy way of doing this is to use, for example, a single “+” sign for a force moderately in your favor, or “--" for a force strongly against you (you can see this in the example below).


Then look at the situation you find using this analysis and think through how it affects you. Bear in mind that few situations are perfect; however use environmental scanning as a framework for thinking through what you could change to increase your power with respect to each force.
This tool was created by Harvard Business School professor, Michael Porter, to analyze the attractiveness and likely-profitability of an industry. Since publication, it has become one of the most important business strategy tools. The classic article which introduces it is "How Competitive Forces Shape Strategy" in Harvard Business Review 57, March - April 1979, pages 86-93.


Example:
Martin Johnson is deciding whether to switch career and become a farmer - he's always loved the countryside, and wants to switch to a career where he's his own boss. He creates the following Five Forces Analysis as he thinks the situation through:


This worries him:
The threat of new entry is quite high: if anyone looks as if they’re making a sustained profit, new competitors can come into the industry easily, reducing profits;
Competitive rivalry is extremely high: if someone raises prices, they’ll be quickly undercut. Intense competition puts strong downward pressure on prices;
Buyer Power is strong, again implying strong downward pressure on prices; and
There is some threat of substitution.
Unless he is able to find some way of changing this situation, this looks like a very tough industry to survive in. Maybe he'll need to specialize in a sector of the market that's protected from some of these forces, or find a related business that's in a stronger position.


Key points:
Porter's Five Forces Analysis is an important tool for assessing the potential for profitability in an industry. With a little adaptation, it is also useful as a way of assessing the balance of power in more general situations.


It works by looking at the strength of five important forces that affect competition:
Supplier Power: The power of suppliers to drive up the prices of your inputs;
Buyer Power: The power of your customers to drive down your prices;
Competitive Rivalry: The strength of competition in the industry;
The Threat of Substitution: The extent to which different products and services can be used in place of your own; and
The Threat of New Entry: The ease with which new competitors can enter the market if they see that you are making good profits (and then drive your prices down).
By thinking through how each force affects you, and by identifying the strength and direction of each force, you can quickly assess the strength of the position and your ability to make a sustained profit in the industry.
You can then look at how you can affect each of the forces to move the balance of power more in your favor.

Wednesday, July 22, 2009

Problem Solving - Part 11

The Boston Matrix
(Also called the BCG Matrix, the Growth-ShareMatrix and Portfolio Analysis)Focusing effort to give the greatest returns


If you enjoy visual representations and vivid descriptions of your business then you'll love the Boston Matrix!

Also called the BCG Matrix, it provides a useful way of looking at the opportunities open to you, and helps you analyse which segments of your business are in a good position – and which ones aren’t. That way, you can decide on the most appropriate investment strategy for your business in the future, and where best to allocate your resources.

Understanding the Model
Market Share and Market Growth
To understand the Boston Matrix you need to understand how market share and market growth interrelate.Market share is the percentage of the total market that is being serviced by your company, measured either in revenue terms or unit volume terms. The higher your market share, the higher proportion of the market you control.The Boston Matrix assumes that if you enjoy a high market share you will normally be making money (this assumption is based on the idea that you will have been in the market long enough to have learned how to be profitable, and will be enjoying scale economies that give you an advantage).The question it asks is, "Should you be investing your resources into that product line just because it is making you money?" The answer is, "not necessarily."This is where market growth comes into play. Market growth is used as a measure of a market's attractiveness. Markets experiencing high growth are ones where the total market is expanding, which should provide the opportunity for businesses to make more money, even if their market share remains stable.By contrast, competition in low growth markets is often bitter, and while you might have high market share now, what will the situation look like in a few months or a few years? This makes low growth markets less attractive.
Note:The origin of the Boston Matrix lies with the Boston Consulting Group in the early 1970s. It was devised as a clear and simple method for helping corporations decide which parts of their business they should allocate their available cash to. Today, this is as important as ever because of the limited availability of credit. However, the Boston Matrix is also a good tool for thinking about where to apply other finite resources: people, time and equipment.
The Matrix ItselfThe Boston Matrix categorizes opportunities into four groups, shown on axes of Market Growth and Market Share:


These groups are explained below:
Dogs: Low Market Share / Low Market Growth
In these areas, your market presence is weak, so it's going to take a lot of hard work to get noticed. Also, you won't enjoy the scale economies of the larger players, so it's going to be difficult to make a profit.
Cash Cows:High Market Share / Low Market Growth
Here, you're well-established, so it's easy to get attention and exploit new opportunities. However it's only worth expending a certain amount of effort, because the market isn't growing and your opportunities are limited.
Stars:High Market Share / High Market Growth
Here you're well-established, and growth is exciting! These are fantastic opportunities, and you should work hard to realize them.
Question Marks (Problem Child):Low Market Share / High Market Growth
These are the opportunities no one knows what to do with. They aren't generating much revenue right now because you don't have a large market share. But, they are in high growth markets so the potential to make money is there.Question Marks might become Stars and eventual Cash Cows, but they could just as easily absorb effort with little return. These opportunities need serious thought as to whether increased investment is warranted.
How to Use The Tool:
To use the Boston Matrix to look at your opportunities, then use the following steps:
Step One: Plot your opportunities in terms of their relative market presence, and market growth on the blank matrix provided on the worksheet.
Step Two: Classify them into one of the four categories. If a product seems to fall right on one of the lines, take a real hard look at the situation and rely on past performance to help you decide which side you will place it.
Note:Be careful about these lines - there's nothing magical about them or their position. There may be very little real difference between a "Problem Child" with a market share of 49%, and a "Star" with a market share of 51%. It's also not necessarily true that the line should run through the 50% position. As ever, use your common sense.
Step Three: Determine what you will do with each product/product line. There are typically four different strategies to apply:
Build Market Share: Make further investments (for example, to maintain Star status, or turn a Question Mark into a Star)
Hold: Maintain the status quo (do nothing)
Harvest: Reduce the investment (enjoy positive cash flow and maximize profits from a Star or Cash Cow)
Divest: For example, get rid of the Dogs, and use the capital to invest in Stars and some Question Marks.
Tip 1:From a personal perspective, you can evaluate the opportunities open to you by substituting the dimension of "Market Share" with one of "Professional Skills". Plot the options open to you on the personal version of the BCG Matrix, and take action appropriately.
Tip 2:A similar (and equally powerful) tool is the Action Priority Matrix, which helps you pick projects which legitimately give you the quickest and highest value returns. By using the BCG Matrix and Action Priority Matrix together, you get the best of both worlds!
Key Points
The Boston Matrix is an effective tool for quickly assessing the options open to you, both on a corporate and personal basis.
With its easily understood classification into "Dogs", "Cash Cows", "Question Marks" and "Stars", it helps you quickly and simply screen the opportunities open to you, and helps you think about how you can make the most of them.

Tuesday, July 7, 2009

The Ansoff Matrix: Part 10

Understanding the risks of different options(Also known as the Product/Market Expansion Grid)


The Marketing Mix and 4 Ps: Part 9

Understanding how to position your market offering


What is marketing? The definition that many marketers learn as they start out in the industry is:


Putting the right product in the right place, at the right price, at the right time.
It's simple! You just need to create a product that a particularly group of people want, put it on sale some place that those same people visit regularly, and price it at a level which matches the value they feel they get out of it; and do all that at a time they want to buy. Then you've got it made!


There's a lot of truth in this idea. However, a lot of hard work needs to go into finding out what customers want, and identifying where they do their shopping. Then you need to figure out how to produce the item at a price that represents value to them, and get it all to come together at the critical time.


But if you get just one element wrong, it can spell disaster. You could be left promoting a car with amazing fuel-economy in a country where fuel is very cheap; or publishing a textbook after the start of the new school year, or selling an item at a price that's too high – or too low – to attract the people you're targeting.


The marketing mix is a good place to start when you are thinking through your plans for a product or service, and it helps you avoid these kinds of mistake.
Understanding the Tool


The marketing mix and the 4 Ps of marketing are often used as synonyms for each other. In fact, they are not necessarily the same thing.


"Marketing mix" is a general phrase used to describe the different kinds of choices organizations have to make in the whole process of bringing a product or service to market. The 4 Ps is one way - probably the best-known way - of defining the marketing mix, and was first expressed in 1960 by E J McCarthy.


The 4Ps are:

Product (or Service)
Place
Price
Promotion


A good way to understand the 4 Ps is by the questions that you need to ask to define you marketing mix. Here are some questions that will help you understand and define each of the four elements:


Product/Service
What does the customer want from the product/service? What needs does it satisfy?
What features does it have to meet these needs?
Are there any features you've missed out?
Are you including costly features that the customer won't actually use?
How and where will the customer use it?
What does it look like? How will customers experience it?
What size(s), color(s), and so on, should it be?
What is it to be called?
How is it branded?
How is it differentiated versus your competitors?
What is the most it can cost to provide, and still be sold sufficiently profitably? (See also Price, below).


Place

Where do buyers look for your product or service?
If they look in a store, what kind? A specialist boutique or in a supermarket, or both? Or online? Or direct, via a catalogue?
How can you access the right distribution channels?
Do you need to use a sales force? Or attend trade fairs? Or make online submissions? Or send samples to catalogue companies?
What do you competitors do, and how can you learn from that and/or differentiate?


Price

What is the value of the product or service to the buyer?
Are there established price points for products or services in this area?
Is the customer price sensitive? Will a small decrease in price gain you extra market share? Or will a small increase be indiscernible, and so gain you extra profit margin?
What discounts should be offered to trade customers, or to other specific segments of your market?
How will your price compare with your competitors?


Promotion


Where and when can you get across your marketing messages to your target market?
Will you reach your audience by advertising in the press, or on TV, or radio, or on billboards? By using direct marketing mailshot? Through PR? On the Internet?
When is the best time to promote? Is there seasonality in the market? Are there any wider environmental issues that suggest or dictate the timing of your market launch, or the timing of subsequent promotions?
How do your competitors do their promotions? And how does that influence your choice of promotional activity?


The 4Ps model is just one of many marketing mix lists that have been developed over the years. And, whilst the questions we have listed above are key, they are just a subset of the detailed probing that may be required to optimize your marketing mix.
Amongst the other marketing mix models have been developed over the years is Boom and Bitner's 7Ps, sometimes called the extended marketing mix, which include the first 4 Ps, plus people, processes and physical layout decisions.


Another marketing mix approach is Lauterborn's 4Cs, which presents the elements of the marketing mix from the buyer's, rather than the seller's, perspective. It is made up of Customer needs and wants (the equivalent of product), Cost (price), Convenience (place) and Communication (promotion). In this article, we focus on the 4Ps model as it is the most well-recognized, and contains the core elements of a good marketing mix.


Using the 4Ps Marketing Mix Model


The marketing mix model can be used to help you decide how to take a new offer to market. It can also be used to test your existing marketing strategy. Whether you are considering a new or existing offer, follow the steps below help you define and improve your marketing mix.
Start by identifying the product or service that you want to analyze.
Now go through and answers the 4Ps questions - as defined in detail above.
Try asking "why" and "what if" questions too, to challenge your offer. For example, ask why your target audience needs a particular feature. What if you drop your price by 5%? What if you offer more colors? Why sell through wholesalers rather than direct channels? What if you improve PR rather than rely on TV advertising?


Tip:

Check through your answers to make sure they are based on sound knowledge and facts. If there are doubts about your assumptions, identify any market research, or facts and figures that you may need to gather.


Once you have a well-defined marketing mix, try "testing" the overall offer from the customer's perspective, by asking customer focused questions:
Does it meet their needs? (product)
Will they find it where they shop? (place)
Will they consider it's priced favorably? (price)
And will the marketing communications reach them? (promotion)
Keep on asking questions and making changes to your mix until you are satisfied that you have optimized your marketing mix, given the information and facts and figures you have available.
Review you marketing mix regularly, as some elements will need to change as the product or service, and its market, grow, mature and adapt in an ever-changing competitive environment.


Key points:


The marketing mix helps you define the marketing elements for successfully positioning your market offer.
One of the best known models is the Four Ps, which helps you define your marketing options in terms of product, place, price and promotion. Use the model when you are planning a new venture, or evaluating an existing offer, to optimize the impact with your target market.

Tuesday, June 9, 2009

P.E.S.T Analysis - Part 8

Understanding "Big Picture" Forces of Change(Also known as PESTLE, PESTEL, PESTLIED, STEEPLE and SLEPT Analysis)


PEST Analysis is a simple, useful and widely-used tool that helps you understand the "big picture" of your Political, Economic, Socio-Cultural and Technological environment. As such, it is used by business leaders worldwide to build their vision of the future.


It is important for these reasons:

First, by making effective use of PEST Analysis, you ensure that what you are doing is aligned positively with the powerful forces of change that are affecting our world. By taking advantage of change, you are much more likely to be successful than if your activities oppose it;
Second, good use of PEST Analysis helps you avoid taking action that is doomed to failure from the outset, for reasons beyond your control; and
Third, PEST is useful when you start operating in a new country or region. Use of PEST helps you break free of unconscious assumptions, and helps you quickly adapt to the realities of the new environment.


How to use the tool:


PEST is a simple mnemonic standing for Political, Economic, Socio-Cultural and Technological.
To use this tool, follow this three stage process:


Brainstorm the relevant factors that apply to you;
Identify the information that applies to these factors; and
Draw conclusions from this information.

To download our free worksheet to record your analysis, click here!


Tip:The important point is to move from the second step to the third step: it is sterile just to describe factors without thinking through what they mean. However, be careful not to assume that your analysis is perfect: use it as a starting point, and test your conclusions against the reality you experience.

The following factors may help as a starting point for brainstorming (but make sure you include other factors that may be appropriate to your situation):


Political:
Government type and stability
Freedom of press, rule of law and levels of bureaucracy and corruption
Regulation and de-regulation trends
Social and employment legislation
Tax policy, and trade and tariff controls
Environmental and consumer-protection legislation
Likely changes in the political environment


Economic:
Stage of business cycle
Current and project economic growth, inflation and interest rates
Unemployment and labor supply
Labor costs
Levels of disposable income and income distribution
Impact of globalization
Likely impact of technological or other change on the economy
Likely changes in the economic environment


Socio-Cultural:
Population growth rate and age profile
Population health, education and social mobility, and attitudes to these
Population employment patterns, job market freedom and attitudes to work
Press attitudes, public opinion, social attitudes and social taboos
Lifestyle choices and attitudes to these
Socio-Cultural changes


Technological Environment:
Impact of emerging technologies
Impact of Internet, reduction in communications costs and increased remote working
Research and Development activity
Impact of technology transfer

Figure 1 below shows this in diagrammatic format:
Figure 1: PEST Analysis in Diagrammatic Format


Other forms of PEST - PESTLE, PESTLIED, STEEPLE and SLEPT:

Some people prefer to use different flavors of PEST Analysis, using other factors for different situations. The variants are:
PESTLE/PESTEL: Political, Economic, Sociological, Technological, Legal, Environmental;
PESTLIED: Political, Economic, Social, Technological, Legal, International, Environmental, Demographic;
STEEPLE: Social/Demographic, Technological, Economic, Environmental, Political, Legal, Ethical; and
SLEPT: Social, Legal, Economic, Political, Technological
Choose the flavor that most suits you!

Example:

We’re going to avoid giving an example here, because of the huge potential for causing offense: few societies seem perfect to outsiders, and there are few things as irritating as having an outsider criticize one's own country...

However, a broad principle is that things that make activity more difficult for people or organizations raise the cost of doing business: business is either stopped altogether, or costs more as people spend time and money circumventing difficulties. The higher the cost of doing business in a region, the more project profitability is squeezed or eliminated. And given that businesspeople normally have at least some level of intelligence, businesses and projects that could otherwise operate are never launched - meaning that less economic activity takes place. (The lower the amount of economic activity, the poorer and less capable societies tend to be.)
Another broad principle is wherever there is rapid or major change in an area, there are likely to be new opportunities and threats that arise. Smart people and companies will take advantage of the opportunities and manage the threats.

And do remember that few situations are perfect: it is up to us to make the most of the situation in which we find ourselves.

Key Points:
PEST Analysis is a useful tool for understanding the “big picture” of the environment in which you are operating, and the opportunities and threats that lie within it. By understanding your environment, you can take advantage of the opportunities and minimize the threats.PEST is a mnemonic standing for Political, Economic, Social and Technological. These headings are used firstly to brainstorm the characteristics of a country or region and, from this, draw conclusions as to the significant forces of change operating within it.
This provides the context within which more detailed planning can take place to take full advantage of the opportunities that present themselves.

Tuesday, May 26, 2009

Problem Soving Part 7: SWAT Analysis

SWOT Analysis
Discover New Opportunities. Manage and Eliminate Threats.


SWOT Analysis is a powerful technique for understanding your Strengths and Weaknesses, and for looking at the Opportunities and Threats you face.
Used in a business context, it helps you carve a sustainable niche in your market. Used in a personal context, it helps you develop your career in a way that takes best advantage of your talents, abilities and opportunities.


Business SWOT Analysis


What makes SWOT particularly powerful is that, with a little thought, it can help you uncover opportunities that you are well placed to exploit. And by understanding the weaknesses of your business, you can manage and eliminate threats that would otherwise catch you unawares.
More than this, by looking at yourself and your competitors using the SWOT framework, you can start to craft a strategy that helps you distinguish yourself from your competitors, so that you can compete successfully in your market.


How to use the tool:


To carry out a SWOT Analysis, answer the following questions:


Strengths:


What advantages does your company have?
What do you do better than anyone else?
What unique or lowest-cost resources do you have access to?
What do people in your market see as your strengths?
What factors mean that you "get the sale"?


Consider this from an internal perspective, and from the point of view of your customers and people in your market. Be realistic: It's far too easy to fall prey to "not invented here syndrome". (If you are having any difficulty with this, try writing down a list of your characteristics. Some of these will hopefully be strengths!)
In looking at your strengths, think about them in relation to your competitors - for example, if all your competitors provide high quality products, then a high quality production process is not a strength in the market, it is a necessity.


Weaknesses:


What could you improve?
What should you avoid?
What are people in your market likely to see as weaknesses?
What factors lose you sales?


Again, consider this from an internal and external basis: Do other people seem to perceive weaknesses that you do not see? Are your competitors doing any better than you? It is best to be realistic now, and face any unpleasant truths as soon as possible.


Opportunities:


Where are the good opportunities facing you?
What are the interesting trends you are aware of?
Useful opportunities can come from such things as:
Changes in technology and markets on both a broad and narrow scale
Changes in government policy related to your field
Changes in social patterns, population profiles, lifestyle changes, etc.


Local events


A useful approach for looking at opportunities is to look at your strengths and ask yourself whether these open up any opportunities.
Alternatively, look at your weaknesses and ask yourself whether you could create opportunities by eliminating them.


Threats:


What obstacles do you face?
What is your competition doing that you should be worried about?
Are the required specifications for your job, products or services changing?
Is changing technology threatening your position?
Do you have bad debt or cash-flow problems?
Could any of your weaknesses seriously threaten your business?


Carrying out this analysis will often be illuminating - both in terms of pointing out what needs to be done, and in putting problems into perspective.
Strengths and weaknesses are often internal to your organization. Opportunities and threats often relate to external factors. For this reason the SWOT Analysis is sometimes called Internal-External Analysis and the SWOT Matrix is sometimes called an IE Matrix Analysis Tool.
You can also apply SWOT Analysis to your competitors. As you do this, you'll start to see how and where you should compete against them.


Tip:

SWOT can be used in two ways - as a simple icebreaker helping people get together and "kick off" strategy formulation, or in a more sophisticated way as a serious strategy tool. If you're using it as a serious tool, make sure you're rigorous in the way you apply it:
Only accept precise, verifiable statements ("Cost advantage of US$10/ton in sourcing raw material x", rather than "Good value for money").


Ruthlessly prune long lists of factors, and prioritize factors so that you spend your time thinking about the most significant factors.


Make sure that options generated are carried through to later stages in the strategy formation process.


Apply it at the right level - for example, at product or product line level, rather than at the much vaguer whole company level.


Supplement it with other option-generation tools - none is likely to be completely comprehensive.


Example:


A start-up small consultancy business might draw up the following SWOT matrix:


Strengths:

We can respond very quickly as we have no red tape, no need for higher management approval, etc.
We can give really good customer care, as the current small amount of work means we have plenty of time to devote to customers
Our lead consultant has strong reputation within the market
We can change direction quickly if our approach isn't working
We have little overhead, so can offer good value to customers.


Weaknesses:


Our company has no market presence or reputation
We have a small staff with a shallow skills base in many areas
We are vulnerable to vital staff being sick, leaving, etc.
Our cash flow will be unreliable in the early stages


Opportunities:

Our business sector is expanding, with many future opportunities for success
Our local council wants to encourage local businesses with work where possible
Our competitors may be slow to adopt new technologies


Threats:

Will developments in technology change this market beyond our ability to adapt?
A small change in focus of a large competitor might wipe out any market position we achieve.
The consultancy may therefore decide to specialize in rapid response, good value services to local businesses. Marketing would be in selected local publications, to get the greatest possible market presence for a set advertising budget. The consultancy should keep up-to-date with changes in technology where possible.

You can see this analysis in diagram format in figure 1 below.


Key points:

SWOT Analysis is a simple but powerful framework for analyzing your company's Strengths and Weaknesses, and the Opportunities and Threats you face. This helps you to focus on your strengths, minimize threats, and take the greatest possible advantage of opportunities available to you.

Tuesday, May 12, 2009

Risk Analysis & Risk Management

Evaluating and Managing the Risks You Face

Almost everything we do in today's business world involves a risk of some kind: customer habits change, new competitors appear, factors outside your control could delay your project. But formal risk analysis and risk management can help you to assess these risks and decide what actions to take to minimize disruptions to your plans. They will also help you to decide whether the strategies you could use to control risk are cost-effective.


How to use the tool:


Here we define risk as 'the perceived extent of possible loss'. Different people will have different views of the impact of a particular risk – what may be a small risk for one person may destroy the livelihood of someone else.


One way of putting figures to risk is to calculate a value for it as:


risk = probability of event x cost of event

Doing this allows you to compare risks objectively. We use this approach formally in decision making with decision trees.

To carry out a risk analysis, follow these steps:

1. Identify Threats:

The first stage of a risk analysis is to identify threats facing you. Threats may be:

  • Human - from individuals or organizations, illness, death, etc.
  • Operational - from disruption to supplies and operations, loss of access to essential assets, failures in distribution, etc.
  • Reputational - from loss of business partner or employee confidence, or damage to reputation in the market.
  • Procedural - from failures of accountability, internal systems and controls, organization, fraud, etc.
  • Project - risks of cost over-runs, jobs taking too long, of insufficient product or service quality, etc.
  • Financial - from business failure, stock market, interest rates, unemployment, etc.
  • Technical - from advances in technology, technical failure, etc.
  • Natural - threats from weather, natural disaster, accident, disease, etc.
  • Political - from changes in tax regimes, public opinion, government policy, foreign influence, etc.
  • Others - Porter's Five Forces analysis may help you identify other risks.

This analysis of threat is important because it is so easy to overlook important threats. One way of trying to capture them all is to use a number of different approaches:

Firstly, run through a list such as the one above, to see if any apply

Secondly, think through the systems, organizations or structures you operate, and analyze risks to any part of those

See if you can see any vulnerabilities within these systems or structures

Ask other people, who might have different perspectives.

2. Estimate Risk:

Once you have identified the threats you face, the next step is to work out the likelihood of the threat being realized and to assess its impact.
One approach to this is to make your best estimate of the probability of the event occurring, and to multiply this by the amount it will cost you to set things right if it happens. This gives you a value for the risk.


3. Managing Risk:

Once you have worked out the value of risks you face, you can start to look at ways of managing them. When you are doing this, it is important to choose cost effective approaches - in most cases, there is no point in spending more to eliminating a risk than the cost of the event if it occurs. Often, it may be better to accept the risk than to use excessive resources to eliminate it.

Risk may be managed in a number of ways:

By using existing assets:Here existing resources can be used to counter risk. This may involve improvements to existing methods and systems, changes in responsibilities, improvements to accountability and internal controls, etc.

By contingency planning:You may decide to accept a risk, but choose to develop a plan to minimize its effects if it happens. A good contingency plan will allow you to take action immediately, with the minimum of project control if you find yourself in a crisis management situation. Contingency plans also form a key part of Business Continuity Planning (BCP) or

Business Continuity management (BCM).

By investing in new resources:Your risk analysis should give you the basis for deciding whether to bring in additional resources to counter the risk. This can also include insuring the risk: Here you pay someone else to carry part of the risk - this is particularly important where the risk is so great as to threaten your or your organization's solvency.

4. Reviews:

Once you have carried out a risk analysis and management exercise, it may be worth carrying out regular reviews. These might involve formal reviews of the risk analysis, or may involve testing systems and plans appropriately.

Key points:

Risk analysis allows you to examine the risks that you or your organization face. It is based on a structured approach to thinking through threats, followed by an evaluation of the probability and cost of events occurring.

Risk analysis forms the basis for risk management and crisis prevention. Here the emphasis is on cost effectiveness. Risk management involves adapting the use of existing resources, contingency planning and good use of new resources.

Tuesday, April 28, 2009

Problem Solving Skills: Part 5

Flow Charts

Understanding and Communicating How a Process WorksRelated variants: Process Maps and Process Flow Diagrams

Flow charts are easy-to-understand diagrams showing how steps in a process fit together. This makes them useful tools for communicating how processes work, and for clearly documenting how a particular job is done. Furthermore, the act of mapping a process out in flow chart format helps you clarify your understanding of the process, and helps you think about where the process can be improved.

A flow chart can therefore be used to:

  • Define and analyze processes;
  • Build a step-by-step picture of the process for analysis, discussion, or communication; and
  • Define, standardize or find areas for improvement in a process

Also, by conveying the information or processes in a step-by-step flow, you can then concentrate more intently on each individual step, without feeling overwhelmed by the bigger picture.

How to Use the Tool:

Most flow charts are made up of three main types of symbol:
Elongated circles, which signify the start or end of a process;

Rectangles, which show instructions or actions; and
Diamonds, which show decisions that must be made

Within each symbol, write down what the symbol represents. This could be the start or finish of the process, the action to be taken, or the decision to be made.
Symbols are connected one to the other by arrows, showing the flow of the process.
Tip:
There are many other flowchart symbols that can also be used. However, remember that an important use of flow charts is in communication: If you use obscure symbols that only part of your audience understands, there’s a good chance that your communication will fail. As ever, keep things simple!

To draw the flow chart, brainstorm process tasks, and list them in the order they occur. Ask questions such as "What really happens next in the process?" and "Does a decision need to be made before the next step?" or “What approvals are required before moving on to the next task?"
Start the flow chart by drawing the elongated circle shape, and labeling it "Start".
Then move to the first action or question, and draw a rectangle or diamond appropriately. Write the action or question down, and draw an arrow from the start symbol to this shape.
Work through your whole process, showing actions and decisions appropriately in the order they occur, and linking these together using arrows to show the flow of the process. Where a decision needs to be made, draw arrows leaving the decision diamond for each possible outcome, and label them with the outcome. And remember to show the end of the process using an elongated circle labeled "Finish".
Finally, challenge your flow chart. Work from step to step asking yourself if you have correctly represented the sequence of actions and decisions involved in the process.
And then (if you're looking to improve the process) look at the steps identified and think about whether work is duplicated, whether other steps should be involved, and whether the right people are doing the right jobs.
Tip:
Flow charts can quickly become so complicated that you can't show them on one piece of paper. This is where you can use "connectors" (shown as numbered circles) where the flow moves off one page, and where it moves onto another. By using the same number for the off-page connector and the on-page connector, you show that the flow is moving from one page to the next.

Example:
The example below shows part of a simple flow chart which helps receptionists route incoming phone calls to the correct department in a company:


Key Points:
Flow charts are simple diagrams that map out a process so that it can easily be communicated to other people.
To draw a flowchart, brainstorm the tasks and decisions made during a process, and write them down in order.
Then map these out in flow chart format using appropriate symbols for the start and end of a process, for actions to be taken and for decisions to be made.
Finally, challenge your flow chart to make sure that it's an accurate representation of the process, and that that it represents the most efficient way of doing the job.